
SIDNEY — Data for Ohio School Report Cards have started to be released. So far the graduation rate, K-3 Literacy and Prepared for Success rankings have been made available to area school districts. Other data, like achievement, gap closing and progress, will be released in February.
The four-year graduation rate applies to the Class of 2014 who graduated within four years; students who entered the ninth grade in 2011 and graduated by 2014. The five-year graduation rate applies to the Class of 2013 who graduated within five years; students who entered the ninth grade in 2010 and graduated by 2014.
The K-3 Literacy grade answers the question: “Are more students learning to read in kindergarten through third grade?” The prepared for success grades have not been determined yet, but the broken-down statistics that are available evaluate many different ways a student who graduates from the district is ready for college or a career, including ACT participation, honors diplomas, advanced placement, and dual-enrollment credit statistics.
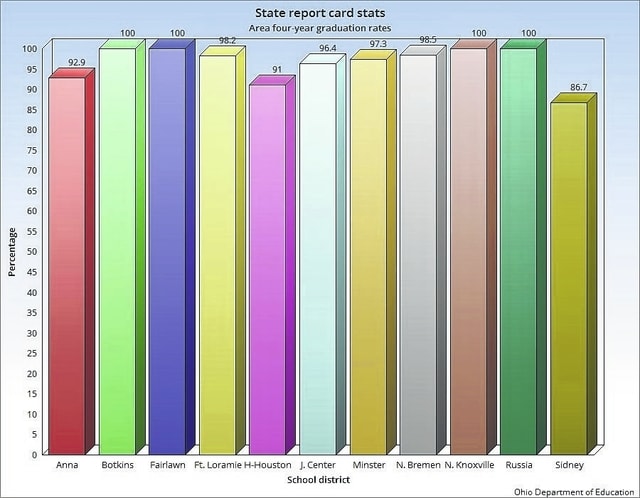
• Anna Local School District received a B for having 92.9 percent of students graduating in four years and an A for having 97.9 percent of students graduating in five years. Anna received a C or 61.5 percent for it K-3 Literacy.
• Botkins Local School District got an A for having 100 percent of students graduating in four years and five years. K-3 Literacy was not calculated for Botkins because there were not enough students to evaluate. “Botkins Local School was pleased with the limited results we have received,” Superintendent Connie Schneider said. “We did not receive a grade in K-3 readiness. This is because we did not have enough students (not on track) to be rated. This is a wonderful position to be in. All of our students that were not on track were on track at the end of the year for report card purposes.” She also said, they are pleased with their Prepared for Success data on the AP average and the percentage of students who earned an honors diploma. Those were 17 percent and 36.2 percent, respectively.
• Fairlawn Local School District received an A for having 100 percent of students graduating in four years and an A for having 97.5 percent of students graduating in five years. Fairlawn received a C or 57.9 percent for its K-3 Literacy rate.
• Fort Loramie Local School District got an A for having 98.2 percent of students graduating in four years and an A for having 98 percent of students graduating in five years. K-3 Literacy was not calculated for Fort Loramie because there were not enough students to evaluate.
• Hardin-Houston Local School District received a B for having 91 percent of students graduating in four years and a C for having 89.7 percent of students graduating in five years. Hardin-Houston received a D or 37.9 percent for its K-3 Literacy rate. “The initial report only provided data in three areas,” Superintendent Larry Claypool said, “one elementary score that related to K-3 Literacy and two high school areas that identified four- and five-year graduation rates.
“In looking at the 10 closest schools in Logan, Miami and Shelby counties, the K-3 Literacy percentages run from 37.9 to 61.5 percent. I think all of our districts who had enough students to report (about six of them) want to report better numbers.
“Regarding our graduation rates, they are somewhat a reflection of our transient society and special needs population … there are minimal things we can do, since four- and five-year rates have within those student populations special needs students who, by law, can attend school through their 21st birthdays.
“In light of the K-3 Literacy, Hardin-Houston is providing all of the supplemental instruction opportunities ODE requires and we hope to improve these grade levels over the next couple of years by developing within our Pre-K and KN curriculum a better way to meet the needs of those children who come to us unprepared for the rigor of today’s modern curriculum requirements.
“The graduation rates are about the same as last year’s. Regarding the K-3 Literacy, there wasn’t a reported score on last year’s report card, but the percentage provided to us unofficially last year for H-H was about 5 percent higher.”
• Jackson Center Local School District got an A for having 96.4 percent of students graduating in four years and an A for having 95.1 percent of students graduating in five years. “What you will see in the smaller schools (like JC) is that we received an NR for our K-3 Literacy. That just means that our sample size was too small for the affected students. Generally, that is a good thing,” Superintendent Bill Reichert said.
• Minster Local School District received an A for 97.3 percent of students graduating in four years and an A for 98.1 percent of students graduating in five years. K-3 Literacy was not calculated for Minster because there were not enough students to evaluate.
• New Bremen Local School District received an A for 98.5 percent of students graduating in four years and an A for 98.8 percent of students graduating in five years. K-3 Literacy was not calculated for New Bremen because there were not enough students to evaluate.
• New Knoxville Local School District got an A for having 100 percent graduating in four and five years. K-3 Literacy was not calculated for New Knoxville because there were not enough students to evaluate.
• Russia Local School District received an A for both four and five years. “Currently the only data for Russia Local School that is available is the graduation rate, which is 100 percent … and we are very proud of that,” Superintendent Steven Rose said. K-3 Literacy was not calculated for Russia because there were not enough students to evaluate.
• Sidney City School District got a C for having 86.7 percent of students graduating in four years and a C for having 89 percent of students graduating in five years. Sidney received a D or 42.5 percent for its K-3 Literacy. Prepared for Success statistics showed Sidney had 43.9 percent of it’s 2014 graduating class enrolled in dual credits. It also had 36.1 percent participate in taking the ACT. Advanced placement participation was at 17.3 percent.
More information, including statewide statistics, and more Prepared for Success facts and figures, can be found at http://reportcard.education.ohio.gov/Pages/default.aspx.
A comprehensive letter grade for each district will not be released until 2018 due to drastic changes in state assessments. Last year, the ODE administered exams through the Partnership for Assessment of Readiness for College and Careers, an organization that prepared exams based on Common Core standards the state has adopted.
An outcry from parents, teachers and school administrators who believed the tests were too complex and time-consuming led Gov. John Kasich to eliminate funding to these exams as part of the state budget he signed in July.
This year, Ohio public schools will use American Institute Research tests, which is the same company that had previously developed the state’s science and social studies exams. AIR will now provide language arts and mathematics exams in addition to science and social studies.
The 2015-16 school year marks the third year in a row with new assessments.

